
How to Interpret Your AGP Report for Better Glucose Management
Living with diabetes means that you have to interpret numbers almost daily. When it comes to understanding your glucose, numbers are great; however, color-coded graphs in your AGP(Ambulatory Glucose Profile) report are also quite helpful in painting a full picture of the current situation. In this article, we’ll guide you through the interpretation of the AGP report step by step.
What’s an AGP Report?
The one-page AGP report is a standardized way of presenting 7-90 days of data from your CGM device. It consists of the same elements regardless of the CGM device that you use. One subtle difference lies in how the AGP report is generated. Some CGMs require an extra login to a web portal to generate the report, while others like the SIBIONICS GS1 allow direct AGP report generation from the SIBIONICS app.
Key Components of an AGP Report:

Figure 1
Understanding the Glucose Metrics Section
This section presents metrics such as Average Glucose, Glucose Variability, and the Glucose Management Indicator(GMI), which estimates your A1C. Above these metrics, you'll find the dates and duration covered in the report, along with the percentage of time your CGM device was actively collecting data.
Average Glucose:
All of your recorded glucose values added together, divided by the number of your total sensor glucose readings.
Glucose Management Indicator(GMI):
Calculated from your Average Glucose; this metric estimates your anticipated laboratory A1C level.
Glucose Variability:
This indicates the frequency of your glucose fluctuations. Ideally, a value of less than 36% is associated with more stable blood glucose levels, implying effective glucose control.
Goals for Time in Ranges Section
The color-coded bar chart in the Time in Ranges section is rather easy to understand. The green bar indicates Time In Range, the yellow and orange parts indicate Time Above Range and the red bar indicates Time Below Range. When interpreting this, we should aim for a larger "green" area, and smaller "red", "yellow" and "orange" areas. In this section, you can also see the percentage of time that your glucose levels stay within, above and below the target range. For people with type 1 or type 2 diabetes, the ideal goal is to spend at least 70% of their time in the target range, less than 25% of their time above range, and less than 4% of their time below range. For older or at-risk people with diabetes, the goal is over 50% time in range, less than 50% of their time above range, and less than 1% below range.

Figure 2
The percentage of TIR, TAR, and TBR is calculated as:
TIR(%)=(Number of In-Range Sensor Glucose Readings / Total Number of Sensor Glucose Readings)×100
TAR(%)=(Number of Above-Range Sensor Glucose Readings / Total Number of Sensor Glucose Readings)×100
TBR(%)=(Number of Below-Range Sensor Glucose Readings / Total Number of Sensor Glucose Readings)×100
Uncover the Mystery of AGP and Daily Glucose Profiles
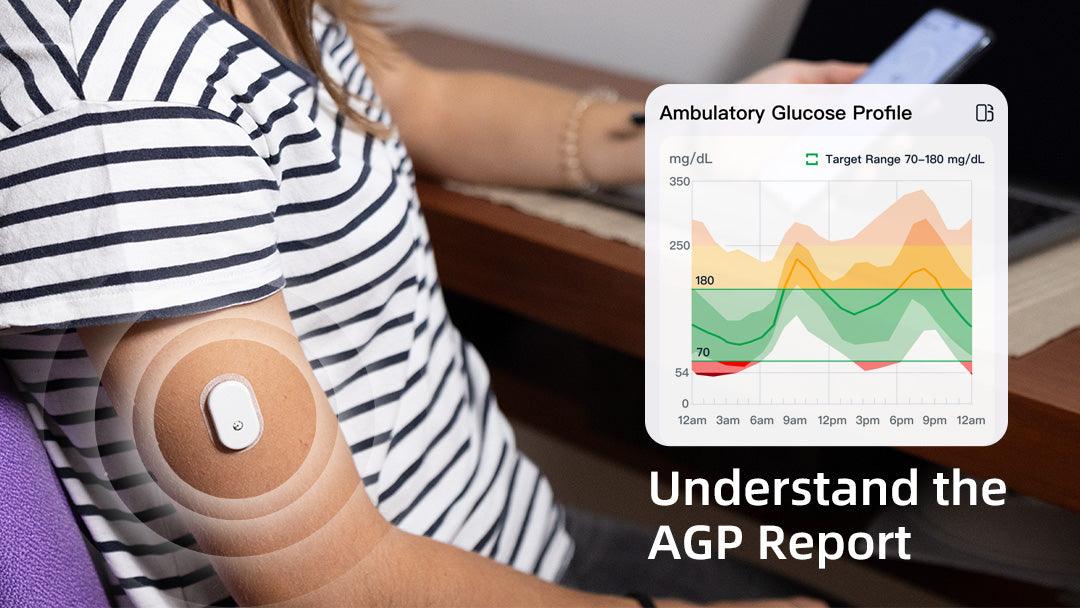
The AGP graph is a visual representation of your glucose trend across 24 hours. It captures the ups and downs of your blood glucose levels throughout the day. Let's break down the key elements in this graph.

Figure 3
Median Line:
The bold, solid line that sits in the middle of the graph represents the median of your glucose readings. Half of your sensor glucose readings are above this line, and the other half are below. Aim for a relatively flat heavy line for better glucose management outcomes.
Darker-Shaded Area:
This area represents 50% of your recorded glucose values. The wider the darker-shaded space is, the more glucose fluctuations are observed. Therefore, this darker-shaded area should be as narrow as possible.
Lighter-Shaded Area:
This area indicates the high and low glucose levels during the selected report period. Similar to the darker-shaded area, the wider this space is, the greater the glucose variability.
Green Area:
The time spent in your target glucose range (usually between 70 and 180 mg/dL)
Yellow Area:
The time spent in a high glucose range (between 180 and 250 mg/dL)
Orange Area:
The time spent in a very high glucose range (above 250 mg/dL).
Red Area:
The time spent in a low glucose range (between 70 and 54 mg/dL)
Dark Red Area:
The time spent in a very low glucose range (below 54 mg/dL)
In Figure 2, the wider yellow and orange areas between 6 pm and 10 pm suggest more frequent glucose spikes during this period compared to other times of the day. Seeing an AGP graph with a pattern like this, the patient or the diabetes team should investigate food intake and activities that happened during this period. Maybe the patient had consumed less healthy meals in the afternoon and had been less active after eating, or the patient had experienced increased stress after 6 pm. Identifying these causes can help with lifestyle adjustments to minimize the patient's glucose spikes.
Daily Glucose Profiles:
Each daily glucose profile shows a single day's glucose pattern during a midnight-to-midnight (24-hour) period. If readings are located:
1) Above the grey-shaded area, then the person could have been experiencing hyperglycemia.
2) Below the grey-shaded area, then the person could have been experiencing hypoglycemia.
Tips for Reviewing Your AGP Report
Investigate Your Time Below Range(TBR)
Reducing the event and risk of hypoglycemia is an important goal for glucose management. If your TBR is higher than the ideal goal(less than 4% for people with type 1 or type 2 diabetes, less than 1% for older or at-risk people with diabetes), then it's crucial to identify the specific times and potential causes of these events. Could it be that you skipped meals, took too much insulin, consumed alcohol before bedtime, or maybe you just had false hypoglycemia because you pressed your sensor during sleep? These aspects are all worth examining.
Look at Your Time Above Range(TAR)
According to Cleveland Clinic, prolonged untreated high blood sugar can lead to serious life-threatening health complications, therefore, evaluation and management of TAR is an essential part of diabetes care. It's advised that less than 25% of your sensor glucose readings are above 180 mg/dL. If over 25% of your readings are above 180 mg/dL, then it's crucial to understand what could have contributed to the situation. Ask yourself questions such as, "Had I missed any doses of oral medications or insulin injections?", and "Did my high glucose appear after eating a big meal, or treating low blood sugar?". The answers to these questions should help you make better decisions about your glucose management.
Check Glucose Variability(GV)
There has been evidence showing that glucose variability is associated with a risk of microvascular and macrovascular complications of diabetes. The suggested goal of Glucose Variability in the AGP report is no more than 36%. When your AGP report shows a GV higher than 36%, try to look into your day-to-day glucose fluctuations and the possible causes. Compare them using the daily glucose profiles, which should help you visualize the most and fewest fluctuations. If your glucose fluctuations on the weekdays and weekends are consistently different, look into your behavioral patterns on these days and explore factors that might lead to this difference. It would also be helpful to log your meals, physical activities, sleep, and medications in the SIBIONICS app, which can provide valuable insights into the potential correlations between your glucose levels and lifestyles.
Save and Compare AGP Reports
Download all your AGP reports from the SIBIONICS app, so you can compare your current AGP report with your past AGP reports, or ask your diabetes team to analyse the difference. Doing this can help you identify the aspects that your glucose management has improved, and the areas that require more effort. Generating the AGP reports is simple. Go to the "AGP Reports" page in the SIBIONICS app, select the period or date from which you need the report to range, and click the "Report" button as shown in Figure 3.

Figure 4
In conclusion, understanding your AGP report is crucial for effective diabetes management. By analyzing the patterns and trends in your glucose levels, you can easily locate periods of concern, such as times of frequent glucose spikes or lows. This actionable insight allows for targeted lifestyle interventions, whether it involves adjusting meal plans, modifying activity levels, or addressing stress factors. Ultimately, a thorough grasp of the AGP report enables you to make informed decisions, leading to better glucose control and improved overall health outcomes. As technology advances, the AGP report will continue to be used as an invaluable tool in the ongoing effort to manage diabetes.
Disclaimer:
Images are for illustrative purposes only. Not from real patient or data.
Treatment decisions should not be made solely based on the AGP report. Opinions expressed in this article are NOT meant to serve as professional medical advice. Individual symptoms, situations, and circumstances may vary. Please consult with your healthcare providers when needed.
References:
Wan EYF, Fung CSC, Fong DYT, Lam CLK. Association of variability in hemoglobin A1c with cardiovascular diseases and mortality in Chinese patients with type 2 diabetes mellitus – A retrospective population-based cohort study. J Diabetes Complications. 2016;30:1240–7. [PubMed] [Google Scholar]
Taya N, Katakami N, Mita T. et al. Associations of continuous glucose monitoring-assessed glucose variability with intima-media thickness and ultrasonic tissue characteristics of the carotid arteries: A cross-sectional analysis in patients with type 2 diabetes. Cardiovasc Diabetol. 2021;20:95. [PMC free article] [PubMed] [Google Scholar]
Malahi AE, Elsen MV, Charleer S. et al. Relationship between time in range, glycemic variability, HbA1c, and complications in adults with type 1 diabetes mellitus. J Clin Endocrinol Metab. 2021;107:e570–81. [PubMed] [Google Scholar]
Pan J, Yan X, Li F. et al. Association of glycaemic variability assessed by continuous glucose monitoring with subclinical diabetic polyneuropathy in type 2 diabetes patients. J Diabetes Invest. 2021;13:328–35. [PMC free article] [PubMed] [Google Scholar]
Zhang X, Yang X, Sun B, Zhu C. Perspectives of glycaemic variability in diabetic neuropathy: A comprehensive review. Commun Biology. 2021;4:1366. [PMC free article] [PubMed] [Google Scholar]


